RSI, MACD and Bollinger Bands explained simply
RSI, MACD, Bollinger Bands. They sound like insider jargon, and they're usually explained with charts full of lines and formulas that kill any interest. A shame, because behind each one there's a simple idea anyone can grasp in two minutes.
They're three tools that look at the same thing, the price, from three different angles. Let's go through them without fear.
RSI: is the coin "stretched"?
RSI answers one question: has the price risen (or fallen) too fast? Picture a rubber band. The more you stretch it, the more likely it snaps back. RSI measures how stretched the band is.
Very high readings say the coin is "overbought" and might take a breather. Very low ones, the opposite. It's not a law, it's a warning: careful, the move here is overdone.
MACD: is the momentum changing?
MACD looks at momentum, that is whether the price's push is building up or running out. It's like watching not just whether a car is going fast, but whether it's accelerating or braking.
When momentum changes direction, it's often the first hint that the price is about to change too. MACD exists precisely to spot that shift before it becomes obvious.
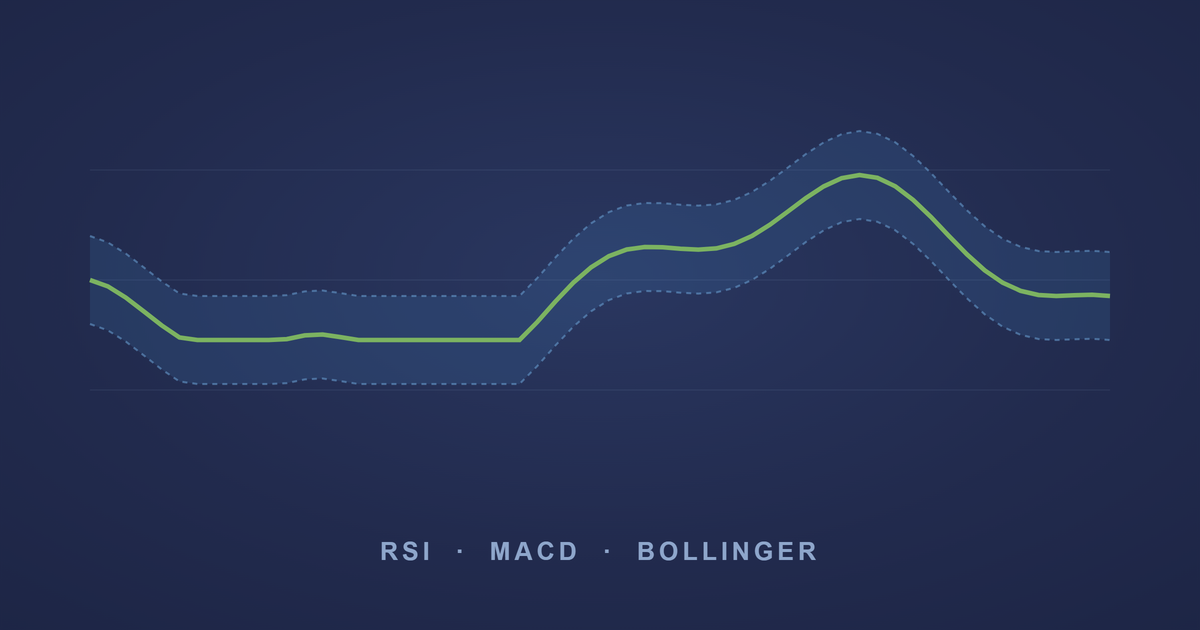
Bollinger Bands: what's "normal" right now
Bollinger Bands draw a corridor around the price: one band above, one below. As long as the price stays inside the corridor, it's moving within its normal range. When it leaves or touches the edges, something unusual is happening.
They also tell you how jumpy the market is: a narrow corridor means calm, a wide one means nervousness and big swings.
The point: none of these is enough on its own
Taken alone, each of these indicators is wrong often. The strength comes when you put them together: if RSI, MACD and the Bands all tell the same story, that story is more reliable.
That's exactly what a model does: instead of looking at one at a time like a person would, it combines them all, across many coins, every day. Not to get the absolute truth, but to weigh the odds better.
High Tide's analyses are statistical, not financial advice. Crypto is risky: only invest what you can afford to lose.